Welcome to pyComBat’s documentation!
Warning
This package is now deprecated, and no longer maintained in its standalone
version. It has been merged into inmoose. Please consider migrating your
code to inmoose.
General Overview
Variability in datasets are not only the product of biological processes: they are also the product of technical biases (Lander et al, 1999). ComBat is one of the most widely used tool for correcting those technical biases called batch effects.
pyComBat (Behdenna et al, 2020) is a new Python implementation of ComBat (Johnson et al, 2007), a software widely used for the adjustment of batch effects in microarray data. While the mathematical framework is strictly the same, pyComBat:
has similar results in terms of batch effects correction;
is as fast or faster than the R implementation of ComBat and;
offers new tools for the community to participate in its development.
Implementation
pyComBat is an open source program written in Python language version 3.7.3. It can be run as a command line or a Python library. It is available at https://github.com/epigenelabs/pyComBat.
License
pyComBat is implemented in the Python language and is available under GPL-3.0 license.
You can find more detailed information in the LICENSE file.
Installing pyComBat
pyComBat is usable as a Python package, which is installed with:
pip install combat
To upgrade the package to the latest version, please use:
pip install combat --upgrade
Then, you can import the pycombat function:
from combat.pycombat import pycombat
Using pyComBat
Minimal usage example
This minimal usage example illustrates how to use pyComBat in a default setting, and shows some results on ovarian cancer data, freely available on NCBI’s Gene Expression Omnibus, namely:
GSE18520
GSE66957
GSE69428
The corresponding expression files are available on GitHub.
# import libraries
from combat.pycombat import pycombat
import pandas as pd
import matplotlib.pyplot as plt

# prepare data
# the datasets are dataframes where:
    # the indexes correspond to the gene names
    # the column names correspond to the sample names
# Any number (>=2) of datasets can be treated
dataset_1 = pd.read_pickle("data/GSE18520.pickle") # datasets can also be stored in csv, tsv, etc files
dataset_2 = pd.read_pickle("data/GSE66957.pickle")
dataset_3 = pd.read_pickle("data/GSE69428.pickle")

# we merge all the datasets into one, by keeping the common genes only
df_expression = pd.concat([dataset_1,dataset_2,dataset_3],join="inner",axis=1)

# plot raw data
plt.boxplot(df_expression)
plt.show()
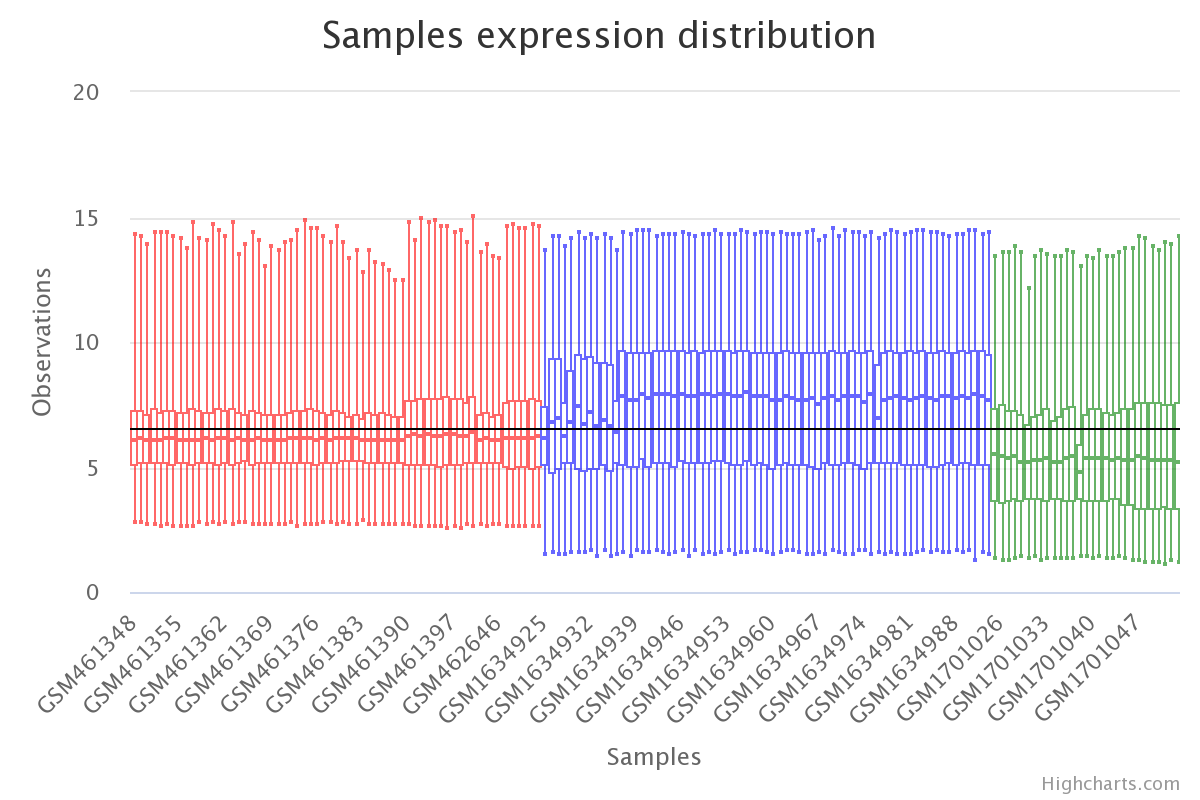
Gene expression by sample in the raw data (colored by dataset).
# we generate the list of batches
batch = []
datasets = [dataset_1,dataset_2,dataset_3]
for j in range(len(datasets)):
    batch.extend([j for _ in range(len(datasets[j].columns))])

# run pyComBat
df_corrected = pycombat(df_expression,batch)

# visualise results
plt.boxplot(df_corrected)
plt.show()
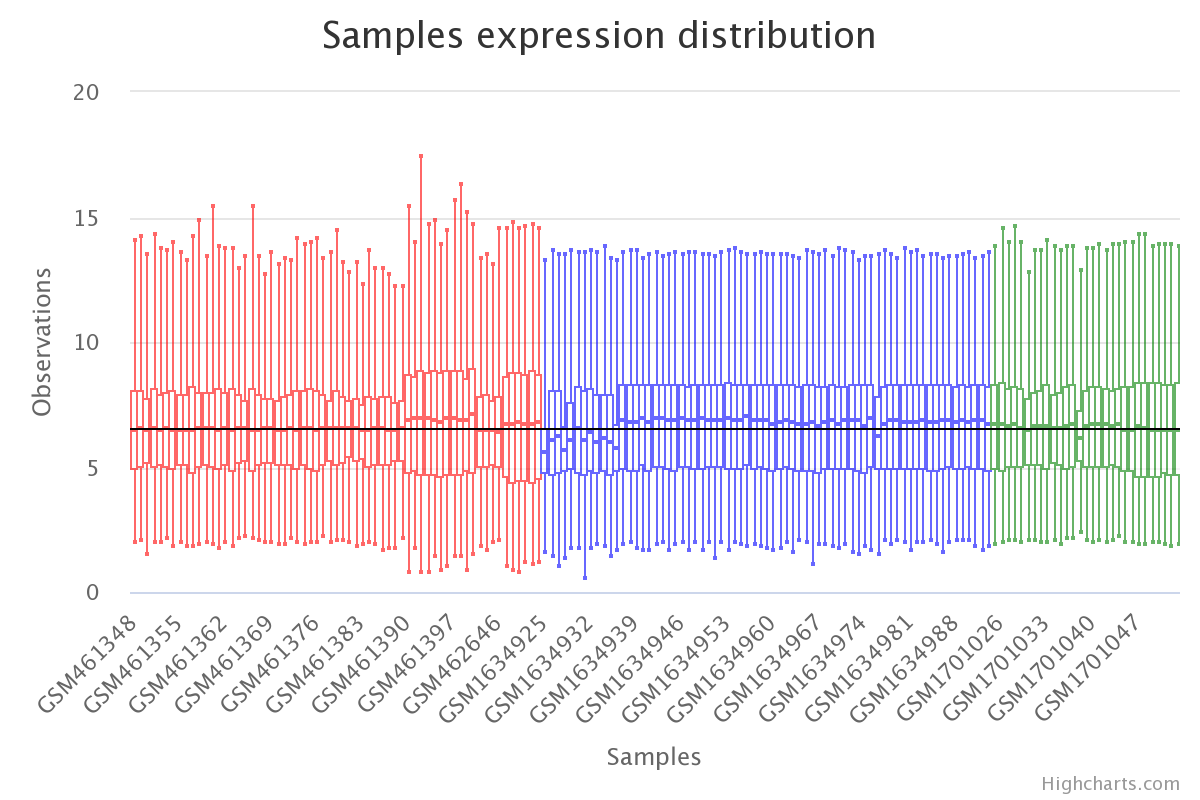
Gene expression by sample in the batch-effects-corrected data (colored by dataset).
Biological Insight
The data we used for the usage example contain tumor samples and normal samples. A simple PCA on the raw expression data shows that, instead of grouping by sample type, the data are clustered by dataset.
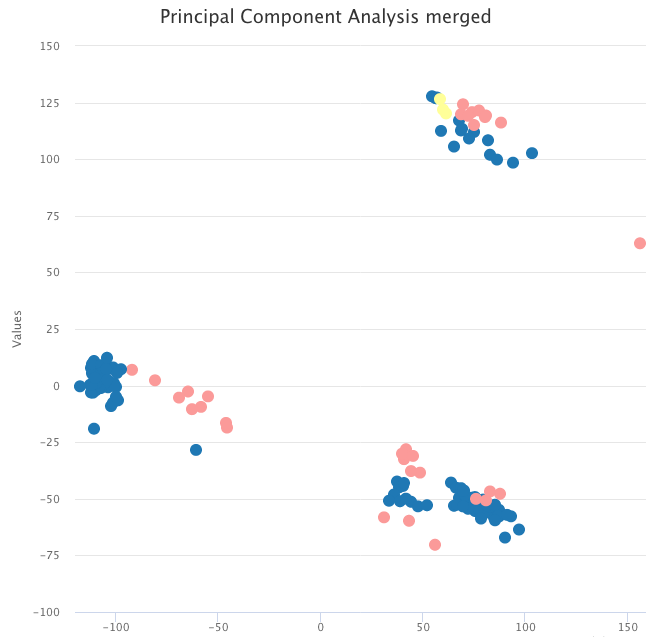
PCA on the raw expression data, colored by tumor sample (blue and yellow) and normal sample (pink).
However, after correcting for batch effects with pyComBat, the same PCA now shows two clusters, respectively with tumor and normal samples.
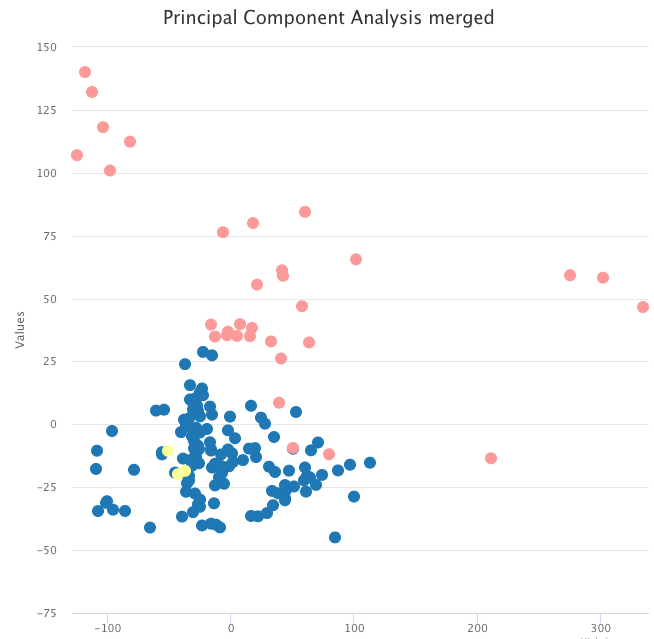
PCA on the batch-effects-corrected expression data, colored by tumor sample (blue and yellow) and normal sample (pink).
Documentation for the code
pyComBat utils
- pycombat.pycombat(data, batch, mod=[], par_prior=True, prior_plots=False, mean_only=False, ref_batch=None, precision=None, **kwargs)[source]
Corrects batch effect in microarray expression data. Takes an gene expression file and a list of known batches corresponding to each sample.
- Arguments:
data {matrix} – The expression matrix (dataframe). It contains the information about the gene expression (rows) for each sample (columns).
batch {list} – List of batch indexes. The batch list describes the batch for each sample. The batches list has as many elements as the number of columns in the expression matrix.
- Keyword Arguments:
mod {list} – List (or list of lists) of covariate(s) indexes. The mod list describes the covariate(s) for each sample. Each mod list has as many elements as the number of columns in the expression matrix (default: {[]}).
par_prior {bool} – False for non-parametric estimation of batch effects (default: {True}).
prior_plots {bool} – True if requires to plot the priors (default: {False} – Not implemented yet!).
mean_only {bool} – True iff just adjusting the means and not individual batch effects (default: {False}).
ref_batch – reference batch selected (default: {None}).
precision {float} – level of precision for precision computing (default: {None}).
- Returns:
bayes_data_df – The expression dataframe adjusted for batch effects.
Contributing to pyComBat
Contribution guidelines
Contribution guidelines can be found in CONTRIBUTING.md.
Unit Testing
Most of the subfunctions can be tested separately. The “unit_test” script implements all of them, and can be used to check the good functioning of the whole pyComBat software.